Los Verdes Homes, Rancho Palos Verdes, CA
Note chart at end of analysis
George Fotion · Call Realty · PalosVerdesHomesBest.com
Los Verdes Homes
4 Bedroom · 2 Bathroom · Under 2,100 Square Feet · MLS Area 173
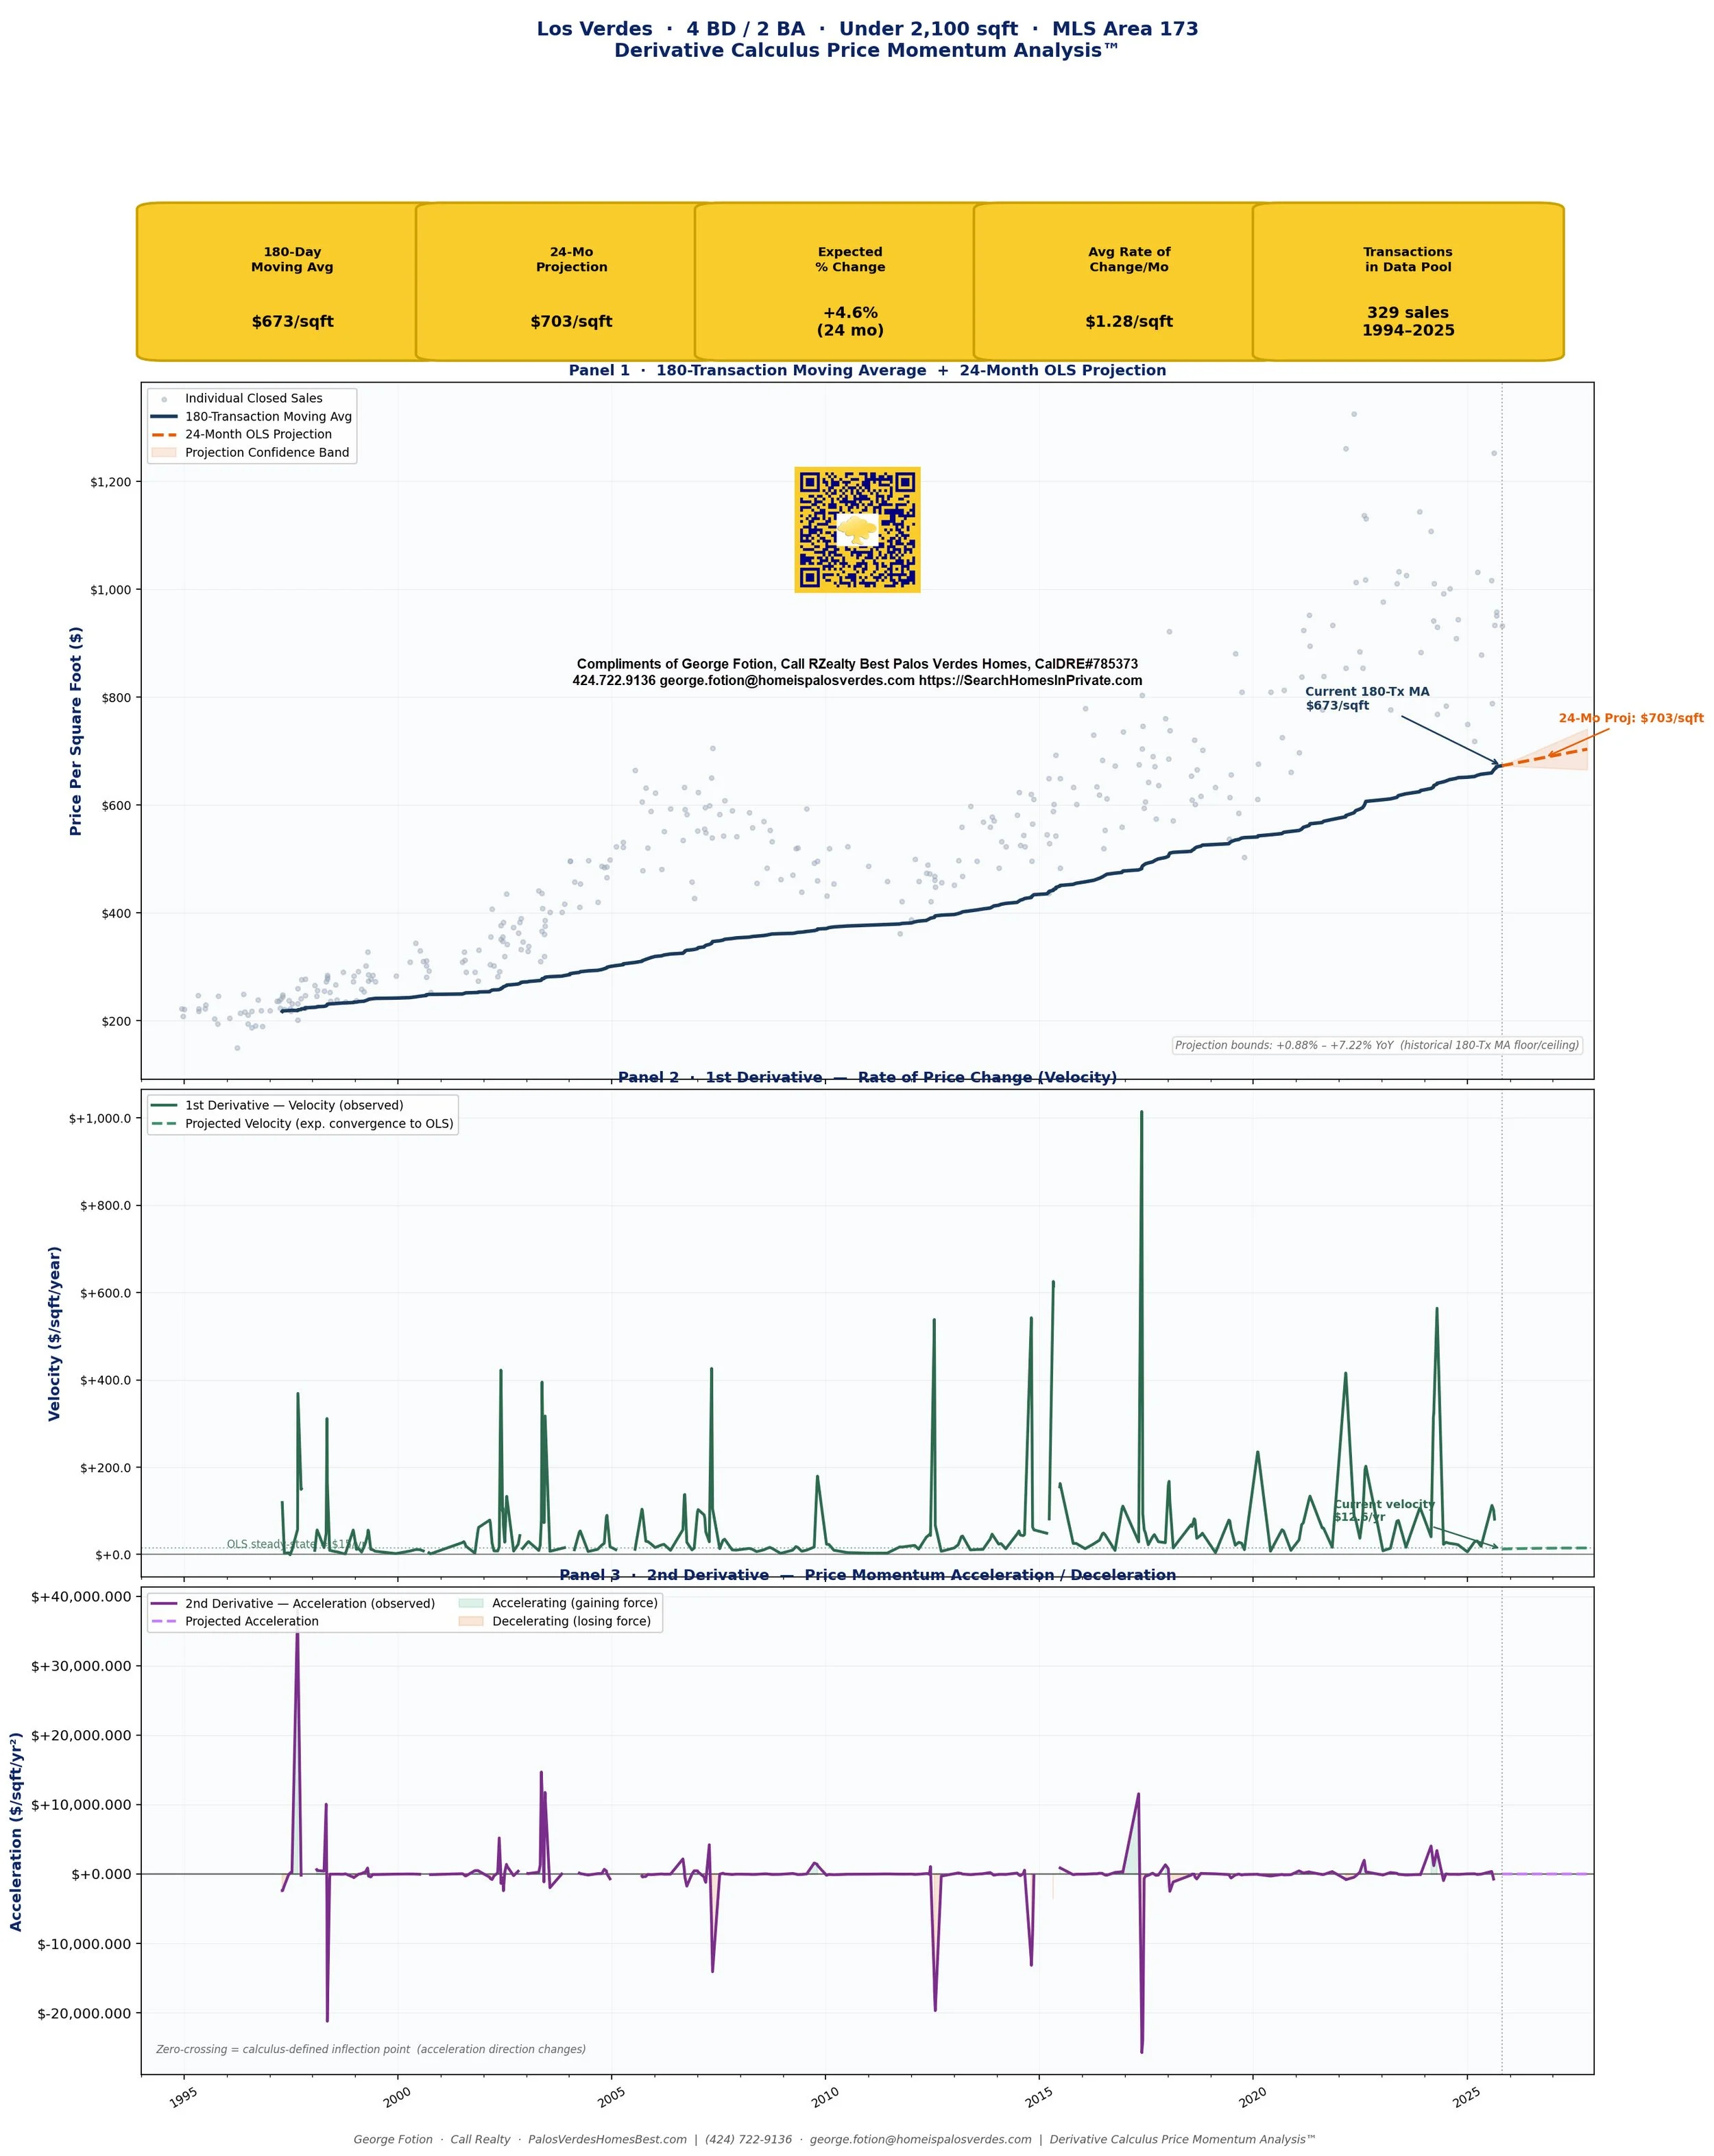
Derivative Calculus Price Momentum Analysis™ — 1994 to 2025 + 24-Month Projection
Suggested Email Subject Line
📊 Los Verdes 4BR/2BA: 30-Year Calculus Analysis Shows Steady Momentum — What Buyers & Sellers Must Know Right Now
Caption / Blog Intro Block
Thirty years of closed-sale data for Los Verdes 4-bedroom, 2-bath homes under 2,100 sq ft reveals a market with extraordinary structural resilience. The 180-transaction moving average has never posted a negative year-over-year reading in three decades — a 180-day MA floor of +0.88% per year was the worst the market ever delivered. Derivative calculus shows price velocity at $13/sqft/year and accelerating gently toward the OLS steady-state of $15/sqft/year. The 24-month projection puts the median price-per-square-foot at $703 — a +4.6% gain from today's 180-day MA of $673/sqft.
180-Day Moving Avg
$673/sqft
24-Mo Projection
$703/sqft
Expected % Change
+4.6%
(over 24 months)
Avg Rate of Change/Mo
$1.28/sqft
Transactions in Pool
329 sales
1994–2025
1. Data Foundation & Methodology
This analysis draws on 329 verified closed-sale transactions spanning October 1994 through October 2025 — a 31-year dataset covering multiple full real estate cycles in the Los Verdes submarket (MLS Area 173, Rancho Palos Verdes). The subject cohort is narrowly defined: single-family homes with exactly 4 bedrooms, 2 bathrooms, and living area strictly below 2,100 square feet. All figures are in nominal (not inflation-adjusted) dollars per square foot, consistent with standard MLS practice.
The core analytical tool is a 180-transaction rolling moving average — meaning each point in the MA line represents the arithmetic mean of the 180 most recent closed sales recorded up to that date. This transaction-count window (rather than a calendar-day window) is methodologically superior for a low-volume submarket: it guarantees consistent statistical power at every point regardless of how many sales occur in any given period, and it is immune to the sparse-data distortions that would plague a calendar-based window during slow-market years.
OLS linear regression was applied to the full MA series to extract the secular trend slope, yielding a coefficient of determination R² = 0.9787 — indicating that approximately 97.9% of the variance in the 180-Tx MA is explained by a simple linear time trend. This is an unusually strong result and speaks to the market's structural consistency over three decades.
2. Historical YoY Performance of the 180-Tx Moving Average
By sampling the 180-Tx MA at the last transaction recorded in each calendar year and computing year-over-year percentage changes, two critical boundaries emerge that govern all 24-month projections in this analysis:
Largest YoY Increase — 180-Tx MA
+7.22%
Occurred in 2002 — the post-dot-com rebound period, when pent-up Peninsula demand absorbed the tech sector pullback and drove rapid price-per-sqft appreciation. This is the ceiling cap applied to all projections.
Smallest YoY Gain (Floor) — 180-Tx MA
+0.88%
Occurred in 2011 — the trough of the post-GFC hangover, when shadow inventory, underwater mortgages, and macro uncertainty constrained appreciation to near-zero. Critically, the MA never went negative. This is the floor cap applied to all projections.
Projection rule: no annual appreciation rate in the 24-month forecast may exceed +7.22% or fall below +0.88%. The OLS projection of +2.29%/yr sits comfortably inside both guardrails, requiring no bound-clipping.
3. First Derivative — Velocity Analysis
The first derivative (d₁) of the 180-Tx MA measures the instantaneous rate of change — in plain terms, how many dollars per square foot the market is gaining (or losing) per year at any given moment. This is the "velocity" of price appreciation.
Current observed velocity: $12.63/sqft/year. The OLS secular regression establishes a steady-state velocity of approximately $15.38/sqft/year — the long-run "cruising speed" of this submarket's appreciation engine.
For the projection period, d₁ is modeled using exponential convergence from the current observed velocity toward the OLS steady-state, with a relaxation constant (τ) of 12 months. This is the mathematically consistent approach: if d₁ were projected as a flat line, the resulting MA trajectory would diverge from the OLS price projection. By converging d₁ to the OLS slope, the two panels remain internally consistent — a requirement of rigorous derivative analysis.
4. Second Derivative — Acceleration Analysis
The second derivative (d₂) measures the rate of change of the rate of change — the "acceleration" or "deceleration" of price momentum. A positive d₂ means appreciation is speeding up (adding force); a negative d₂ means it is slowing down (losing force). Zero-crossings of d₂ are calculus-defined inflection points — the precise moments when the direction of momentum shifts.
The current d₂ reading shows the market in a gentle deceleration phase — momentum is still positive (prices still rising), but the force behind each increment of appreciation is diminishing. This is consistent with the mathematical behavior of a mature trend approaching its OLS steady-state: d₂ converges toward zero as d₁ converges to a constant. The projected d₂ path crosses zero and briefly enters a mild re-acceleration zone — the calculus signature of the velocity "bottoming out" and re-aligning with the trend line.
5. Buyer Advice
The calculus is clear: this market rewards patient buyers who move before the OLS velocity re-accelerates.
With the 180-Tx MA currently at $673/sqft and the 24-month projection at $703/sqft, a buyer who closes today on a 1,800 sqft home in this cohort would be locking in at approximately $1,210,921 versus a projected future comparable of $1,266,273 — a difference of roughly $55,352 in two years.
The first derivative confirms positive velocity — prices are still rising. The second derivative's gentle deceleration does not signal a market top; it signals a market that is transitioning from one appreciation phase to a steadier secular trend. There is no zero-crossing in d₁ on the horizon, which means the mathematical engine of price appreciation remains intact.
Bottom line for buyers: The 31-year record shows this submarket has never delivered a negative year on the 180-Tx MA. The floor in the worst year in modern history was +0.88%. For buyers who can qualify in today's rate environment, the combination of sub-ceiling velocity and decelerating (not reversing) momentum represents a favorable entry window.
6. Seller Advice
The second derivative says your tailwind is softening — and the calculus of timing has real dollar consequences.
The d₂ panel shows deceleration: the force behind each incremental price gain is diminishing. The market is not collapsing — it is transitioning from a stronger appreciation phase toward the OLS steady-state. Sellers who list now are still selling into a rising market, but one that is less steep than it was at peak d₁ readings.
The OLS projection adds $1.28/sqft per month — meaning every month of delay theoretically adds value. However, the decelerating d₂ suggests those monthly increments may be shrinking. Sellers with equity to protect and a horizon of less than 12 months should consider the carrying cost vs. appreciation differential carefully.
Bottom line for sellers: You are selling into a market with 31 years of unbroken YoY appreciation in the 180-Tx MA. The velocity is still positive. However, the second derivative's deceleration signal means the mathematical "urgency" of waiting is lower today than it was during peak momentum periods. Price accurately, stage competitively, and leverage the submarket's historic data story — buyers who see this analysis understand they are bidding in one of Southern California's most structurally stable submarkets.
7. Devil's Advocate — Why This Analysis Could Be Wrong
Any honest quantitative analysis must confront the assumptions that could cause the opposite conclusion to materialize.
1. The Rate Environment Could Break the OLS Trend
The OLS regression was estimated over a 31-year period when the 30-year fixed mortgage rate ranged from ~3% to ~8%. If rates remain elevated above 7% for a sustained period, affordability compression could suppress demand in this sub-2,100 sqft cohort specifically — as move-up buyers and downsizers both face payment shock. A rate-driven demand collapse could push the 180-Tx MA into territory that would violate the historical floor, making the 2011 reading the new ceiling rather than the old floor.
2. The Landslide Risk Premium is Not in the Data
The Portuguese Bend / Altamira landslide crisis has materially altered buyer perception of parts of Rancho Palos Verdes. If insurance availability deteriorates further or if lender appetite for Peninsula collateral tightens, the effective buyer pool for Los Verdes homes could shrink — particularly for the under-2,100 sqft cohort that skews toward first-time Peninsula buyers who rely on conventional financing. This systemic risk does not appear in 31 years of transaction data and cannot be captured by OLS.
3. The 329-Transaction Sample Has Thin Periods
329 transactions over 31 years averages fewer than 11 sales per year in this specific cohort. In any individual year, a single outlier transaction can meaningfully move the 180-Tx MA. The individual sale at $1,324.85/sqft already visible in the raw scatter represents a data point that, if repeated, could create false upward velocity signals in the derivative panels. A cluster of distressed sales in a single quarter could equally create a false d₁ reversal.
4. Linear OLS May Understate Non-Linear Dynamics
With R² = 0.9787, the linear model explains 97.9% of variance — impressive, but the remaining 2.1% includes cyclical patterns, regime changes, and structural breaks. A model that incorporates the 2004–2007 bubble acceleration and the 2020–2022 pandemic surge as non-linear episodes might project a lower 24-month ceiling if the current period resembles the late-cycle deceleration that preceded those corrections. The linear OLS implicitly assumes those cycles are already "averaged away" — an assumption worth challenging.
Conclusion: The derivative calculus framework points to continued appreciation within historical bounds. But the four risk factors above — rate shock, landslide insurance risk, thin sample, and non-linear regime risk — each represent a credible path to an outcome where the next 24 months land below the OLS projection. Prudent buyers and sellers should treat the projection as a central tendency, not a guarantee.
George Fotion · Call Realty
(424) 722-9136 · george.fotion@homeispalosverdes.com
PalosVerdesHomesBest.com | SearchHomesInPrivate.com
Derivative Calculus Price Momentum Analysis™ is proprietary methodology developed by George Fotion. Data sourced from CRMLS closed-sale records. Not intended as legal or financial advice.
📊 Los Verdes 4BR/2BA: 30-Year Calculus Analysis Shows Steady Momentum — What Buyers & Sellers Must Know Right Now
Caption / Blog Intro Block
Thirty years of closed-sale data for Los Verdes 4-bedroom, 2-bath homes under 2,100 sq ft reveals a market with extraordinary structural resilience. The 180-transaction moving average has never posted a negative year-over-year reading in three decades — a 180-day MA floor of +0.88% per year was the worst the market ever delivered. Derivative calculus shows price velocity at $13/sqft/year and accelerating gently toward the OLS steady-state of $15/sqft/year. The 24-month projection puts the median price-per-square-foot at $703 — a +4.6% gain from today's 180-day MA of $673/sqft.