I analyzed 416 closed sales of luxury homes over 5,000 square feet in Palos Verdes Estates, Rancho Palos Verdes, Rolling Hills, and Rolling Hills Estates. This data-driven deep dive reveals:
✅ Median close price: $4.75M
✅ Price per square foot trends (2016-2025)
✅ 12-month projection: $769/sqft (-13.4%)
✅ Days on market: 119 (up from 40)
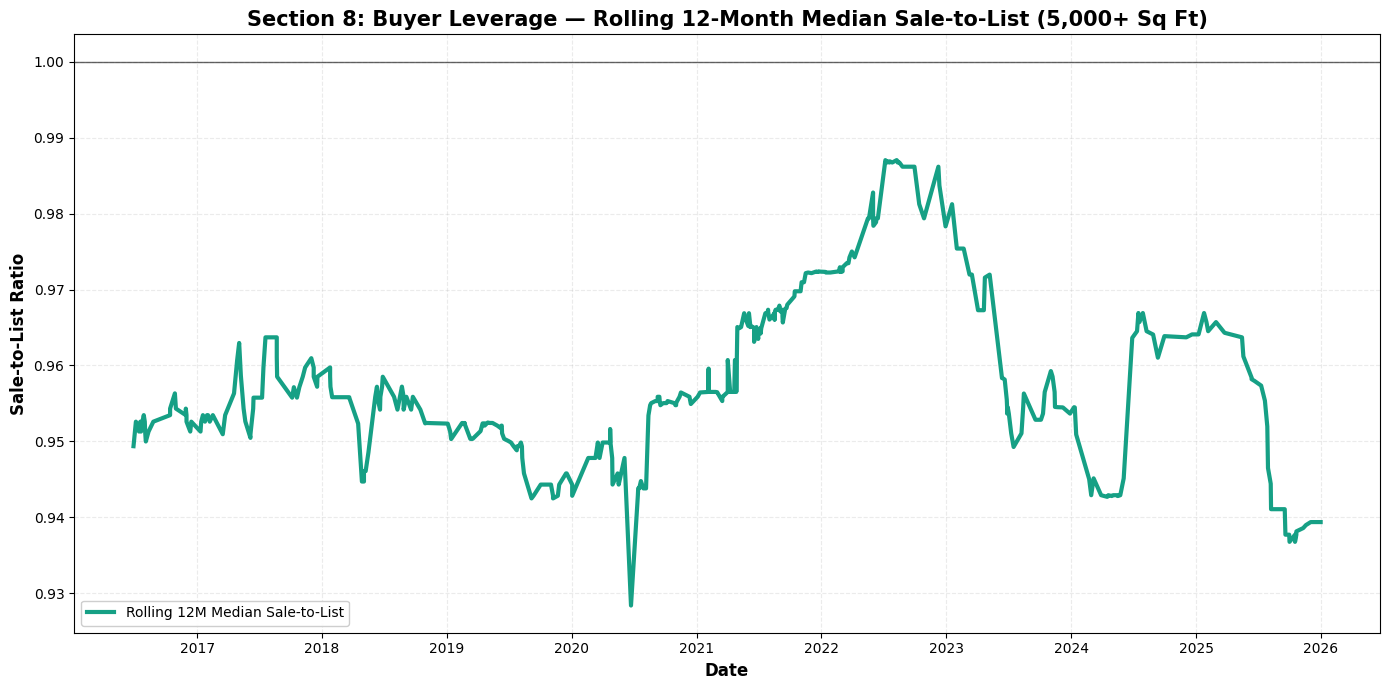
✅ Sale-to-list ratio: 93.9%
✅ City-by-city breakdown
✅ Why ocean views command premium pricing
Do not miss the charts and video at the end of this blog … stick with me here … I promise, there’s insight here you will not find anywhere else to help you strategize what’s in YOUR interests!
Palos Verdes 5,000+ Sq Ft Market Update: Bigger Homes, Bigger Spreads, and a Clear Shift in Momentum
If you’ve been watching the Palos Verdes Peninsula luxury market, you already know the rule: once you cross roughly 5,000 square feet, the market stops behaving like “normal” housing. Buyer pools narrow, pricing becomes more view-and-lot dependent, and days on market can swing wildly based on presentation, condition, and (most of all) scarcity.
Using the full dataset from your spreadsheet (closed sales only; Palos Verdes Peninsula cities; 5,000+ living area), here’s what the numbers say about where this segment has been—and what it looks like right now.
What’s in the dataset (and what it represents)
This analysis is built from 416 closed sales of 5,000+ sq ft homes across Palos Verdes Peninsula markets, spanning:
Date range: 2016-02-02 to 2025-12-31
Key fields used: close price, list price, original list price, $/sqft, cumulative days on market, beds/baths, lot size, and “View” descriptors.
Cities included (as labeled in the file): Palos Verdes Estates, Rancho Palos Verdes, Rolling Hills, Rolling Hills Estates, and a small number labeled “Palos Verdes Peninsula.”
This is a deep sample for a niche segment—large enough to show meaningful trend shifts.
The market in one snapshot (2016–2025)
Across the full time window:
Median closed price: $4,751,000
Average closed price: $5,332,757
Median price per square foot: $759.76/sqft
Average price per square foot: $805.94/sqft
Median cumulative days on market (CDOM): 86 days
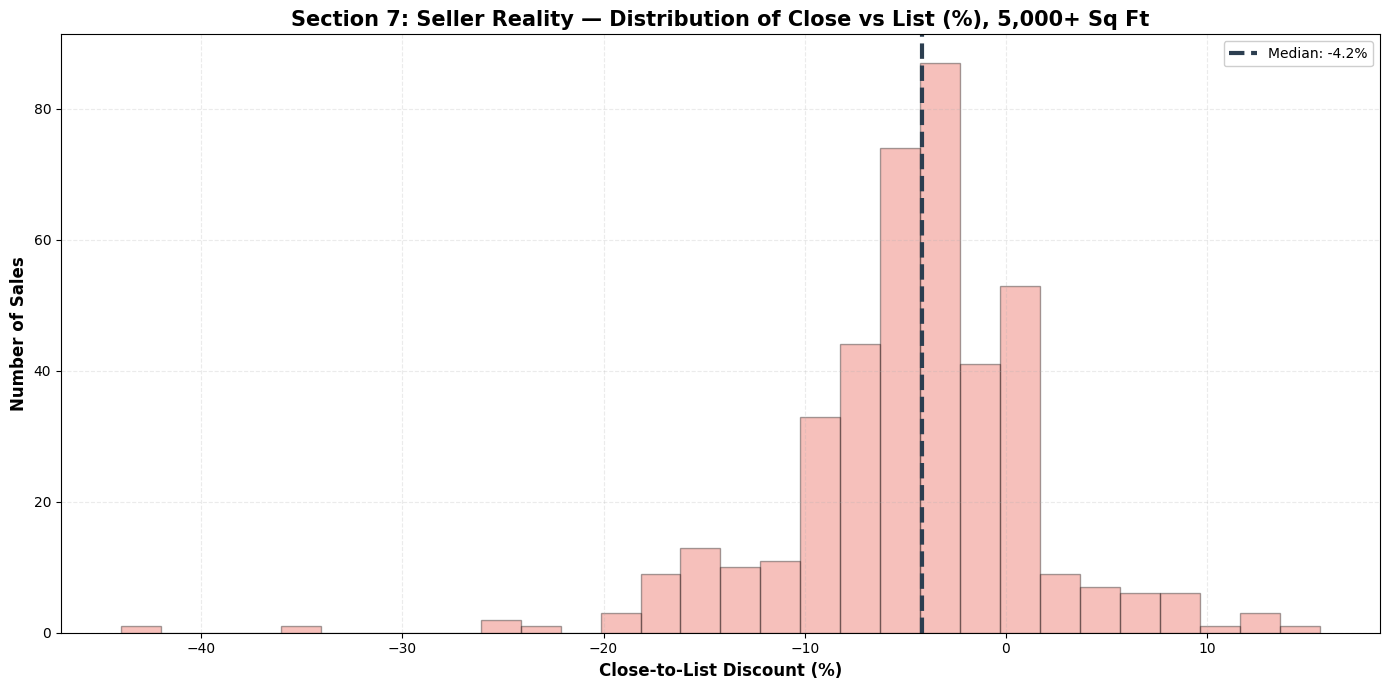
Median sale-to-list ratio: 0.958 (about 4.2% below list)
% of sales closing over list: 12.0%
The takeaway: even in strong years, this is not a “everything sells instantly at or above ask” segment. Pricing precision matters, and the typical transaction closes below list.
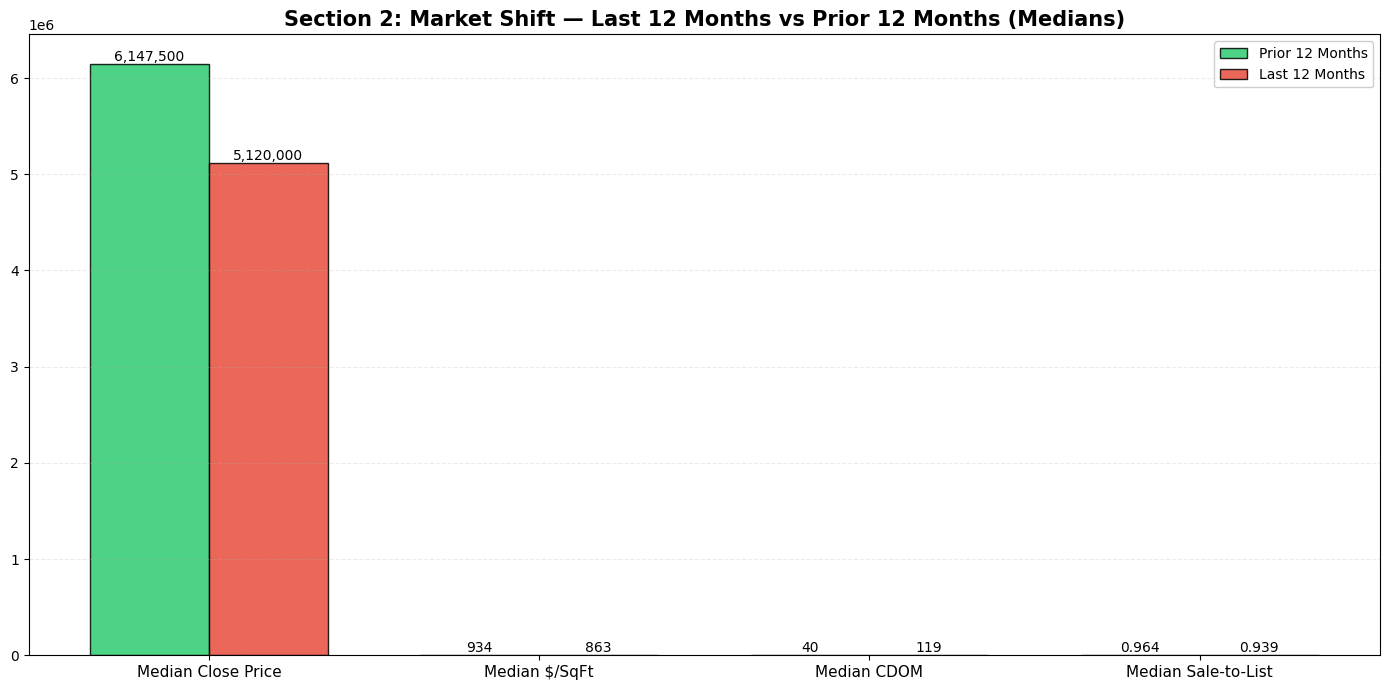
The recent shift: last 12 months vs prior 12 months
The most important story in your data is the momentum change between the last two 12‑month periods (ending 2025-12-31):
Last 12 months (most recent year)
Sales: 31
Median close price: $5,120,000
Median /sqft:** **\862.98
Median CDOM: 119 days
Median sale-to-list: 0.939
% over list: 6.45%
Prior 12 months
Sales: 28
Median close price: $6,147,500
Median /sqft:** **\933.65
Median CDOM: 40.5 days
Median sale-to-list: 0.964
% over list: 10.71%
fWhat that means in plain English:
Homes are taking much longer to sell (median CDOM jumped from ~40 days to 119).
Buyers are negotiating harder (sale-to-list slipped from ~0.964 to 0.939).
The frequency of “over-ask” outcomes is down.
Median pricing (both total and $/sqft) softened versus the prior year.
This is what a normalization looks like in luxury: not a crash, but more time, more leverage for buyers, and more sensitivity to condition and pricing.

Year-by-year trend: the boom, the peak, then cooling
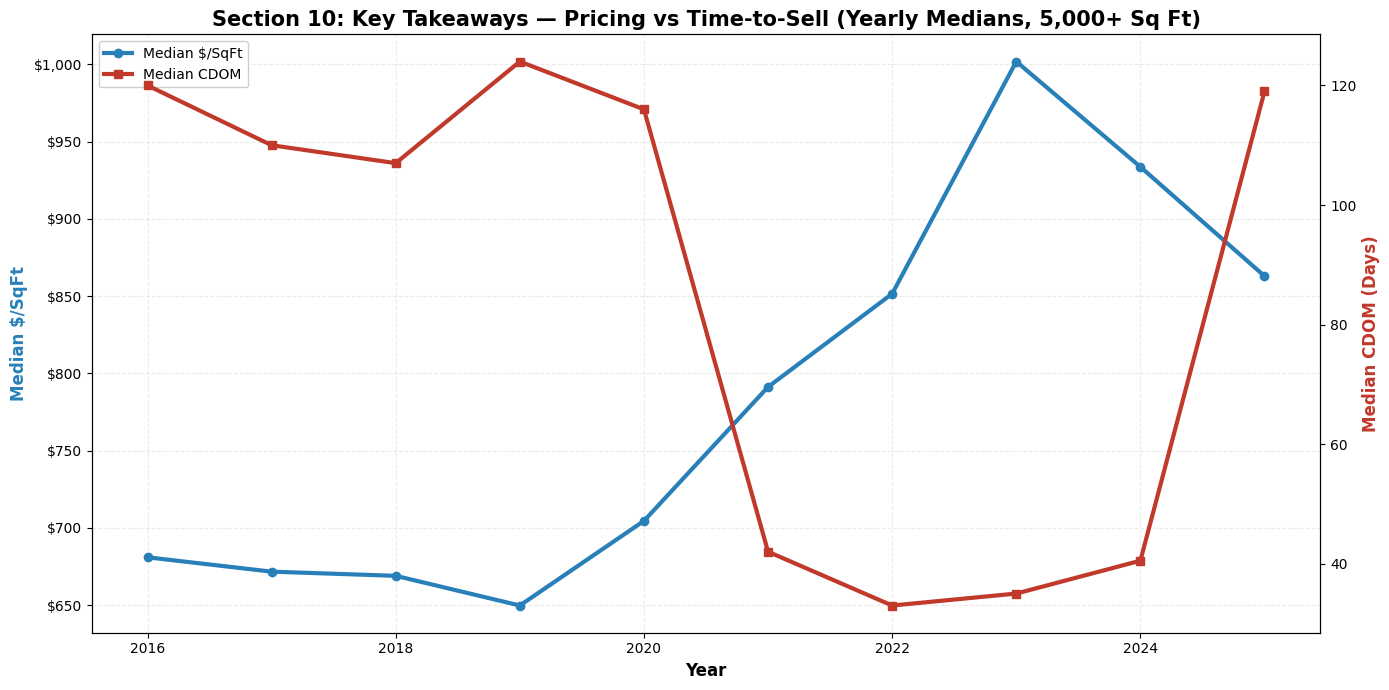
Your yearly medians tell a clear cycle:
2016–2019: Median /sqft mostly in the **\650–$681** range
2020: Improvement begins ($704.55/sqft)
2021: Major acceleration ($791.23/sqft) and DOM collapses (median 42 days)
2022: Continues stronger ($851.54/sqft, DOM median 33 days)
2023: The high-water mark in /sqft (**\1,001.82/sqft**)
2024: Pullback ($933.65/sqft)
2025: Further cooling ($862.98/sqft) and DOM spikes (median 119 days)
The post-2023 period in the data looks like price discovery returning.
Where the 5,000+ market is strongest (by city)
City medians (5,000+ sq ft, closed):
Palos Verdes Estates (164 sales)
Median close: $5,025,000
Median /sqft: **\789.43**
Median CDOM: 93
Rancho Palos Verdes (133 sales)
Median close: $4,213,000
Median /sqft: **\698.72**
Median CDOM: 86
Rolling Hills (71 sales)
Median close: $5,500,000
Median /sqft: **\865.90**
Median CDOM: 132
Rolling Hills Estates (42 sales)
Median close: $4,295,000
Median /sqft: **\829.72**
Median CDOM: 52
Interpretation: Rolling Hills posts a higher median $/sqft in this segment—but also the longest median marketing time. That’s consistent with a market where trophy assets can command premiums, but the buyer pool is thinner and patience is often required.
Views matter—because buyers pay for scarcity
Your “View” field is extremely revealing. In 5,000+ sq ft sales:
Ocean: 308 sales
Coastline: 204
City Lights: 201
Panoramic: 200
Catalina: 118
In other words, a huge share of the upper-size market is trading with some kind of “signature view” language attached. That aligns with how this segment prices: for many of these properties, $/sqft is less about construction cost and more about replaceability.
The top end is not just expensive—it’s uneven
The upper tail in your spreadsheet includes true outliers, which is exactly why averages can mislead in this segment.
A few examples from the highest closed prices in the dataset (5,000+ sq ft):
1 Buggy Whip, Rolling Hills — $22,400,000 (huge recorded living area; extremely unique)
909 Via Coronel, PVE — $17,150,000
Multiple Rolling Hills “Crest” sales in the mid-$15M range
952 Paseo La Cresta, PVE — $12,500,000
These are not “comps” for most 5,000+ homes; they are their own category. But they do influence perception and headlines—while the median tells you what’s happening for the typical transaction.
So where is the market now?
Based on the most recent year of closings in your dataset:
The market is still clearing at high nominal prices, but it’s doing so with:
longer marketing time
bigger negotiating gaps
fewer bidding-style outcomes
The 5,000+ segment appears to be in a buyer-leaning phase compared with 2021–2023.
What sellers should take from this
In a market like this, “testing the market” is expensive. The numbers strongly suggest that:
Correct pricing and strong preparation matter more now than in the peak era.
Overpricing shows up not only in discount-to-list, but in time (CDOM).
View-driven and turnkey properties can still outperform—but the bar is higher.
What buyers should take from this
If you’re shopping 5,000+ sq ft in PV:
The data supports that leverage has improved versus the prior year.
Sale-to-list ratios are lower and time-to-contract is longer.
That combination often creates room for:
inspection/repair credits,
pricing concessions,
and more selective negotiation on condition.


First, let's set the stage. I filtered the data to only include CLOSED sales of homes 5,000 square feet or larger across Palos Verdes Estates, Rancho Palos Verdes, Rolling Hills, and Rolling Hills Estates.
Here's what the overall market looks like from 2016 to the end of 2025:
416 total sales
Median close price: $4.75 million
Average close price: $5.33 million
Median price per square foot: $760
Median days on market: 86 days
Typical sale-to-list ratio: 95.8%—meaning most homes sell about 4% below asking
"So right away, we see this is NOT a market where everything sells instantly at or above list. Even in strong years, pricing matters. Buyers negotiate. And time on market is real.
But here's where it gets interesting...
SECTION 2: THE SHIFT—LAST 12 MONTHS VS PRIOR 12 MONTHS (2:00-4:00)
The most important story in this data is what's happened in the LAST 12 months compared to the PRIOR 12 months. This is where you see the momentum shift.
Prior 12 months (2024):
28 sales
Median close price: $6.15 million
Median price per square foot: $934
Median days on market: 40 days
Sale-to-list ratio: 96.4%
10.7% of homes sold OVER asking
That's a hot market. Homes moving fast, minimal negotiation, some bidding wars.
Now look at the LAST 12 months (2025):
31 sales
Median close price: $5.12 million
Median price per square foot: $863
Median days on market: 119 days
Sale-to-list ratio: 93.9%
Only 6.5% of homes sold over asking
That's a VERY different market. Homes are taking THREE TIMES longer to sell. Buyers are negotiating harder—closing about 6% below list instead of 3.6%. And over-asking outcomes are cut in half.
This isn't a crash. It's a normalization. But if you're a seller pricing like it's still 2023, you're going to sit on the market. And if you're a buyer, you have leverage you didn't have two years ago.
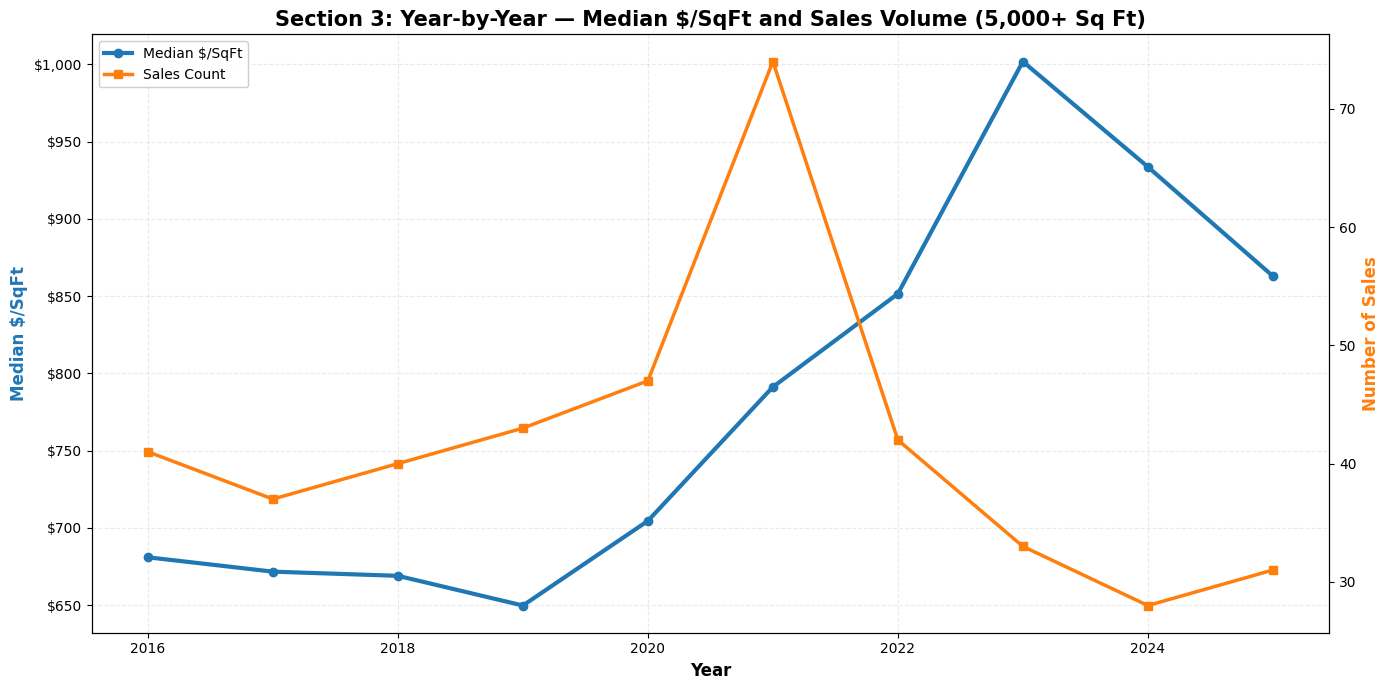
Let's zoom out and look at the year-by-year trend in price per square foot, because this tells the whole story:
2016-2019: $650-$680 per square foot—relatively stable
2020: $705—the pandemic bump begins
2021: $791—acceleration mode, days on market collapse to 42
2022: $852—still climbing, DOM at 33 days
2023: $1,002—the PEAK. Over $1,000 per square foot
2024: $934—pullback begins
2025: $863—further cooling, days on market spike to 119
So 2023 was the high-water mark. Since then, we've seen price discovery return. The market is still expensive by historical standards, but the frenzy is over.
And that brings us to the projection...
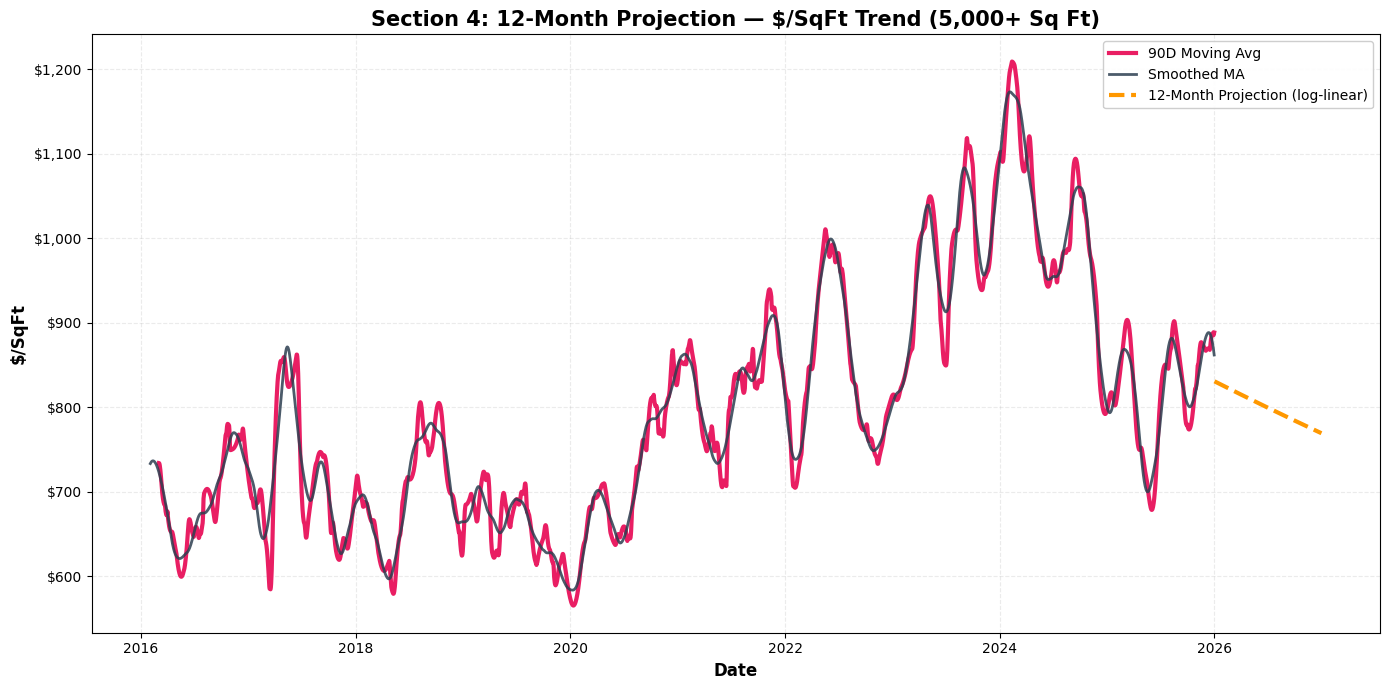
Using a 90-day moving average and a robust log-linear model—basically calculus applied to real estate—I projected where the market is headed over the next 12 months.
Current 90-day moving average: $889 per square foot
12-month projection: $769 per square foot
That's a projected decline of about 13.4%.
Now, before you panic or celebrate, let me give you the three reasons I stand behind this number—and then I'll play devil's advocate and tell you why I might be wrong.
Why I believe this projection:
1. I'm using a model that CAN'T go negative. The first version of this analysis used a linear slope that would've crashed the market to $266 per square foot—obviously nonsense. This version uses a log-linear fit, which projects percentage changes, not dollar amounts, so it stays realistic.
2. The trend is smoothed and time-consistent. I'm not just looking at the last few sales. I built a daily time series, interpolated missing days, and calculated a 90-day trailing moving average. Then I used calculus—specifically a smoothed derivative—to measure the rate of change. This reduces noise and gives a cleaner signal.
3. I controlled for outliers without deleting data. I winsorized the data at the 1st and 99th percentile, so extreme trophy sales still count but don't dominate the trend. That's important in Palos Verdes where a $22 million estate can skew the numbers.
"But here's the devil's advocate case—why this projection could be WRONG:
1. Mix shift, not price shift. If next year has more ocean-view estates and fewer canyon properties, the average $/sqft could rise even if underlying demand is flat. This is sales data, not repeat-sales or same-home comps, so composition matters.
2. Smoothing can lag turning points. If the market is already stabilizing, my model might still be projecting decline because it's based on the last 3 years, which includes the 2023 peak and the post-peak correction.
3. Luxury markets don't move in smooth lines. They move in regime shifts—interest rates, stock market, inventory shocks. A log-linear model assumes steady percentage drift. Reality might be choppier—or flatter—than that.
"So take the projection as a DATA-DRIVEN ESTIMATE, not a guarantee. The trend is real. The direction is clear. But the exact number? That depends on what happens with rates, inventory, and buyer psychology over the next year.
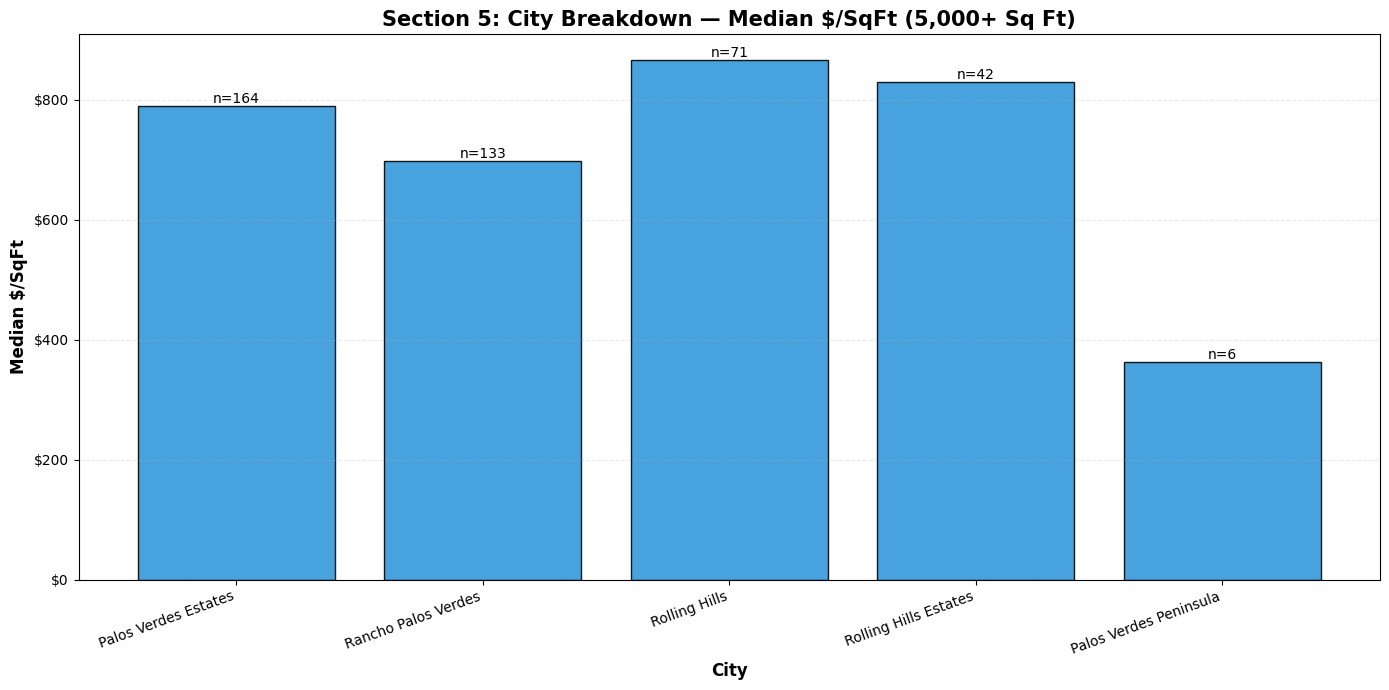
Let's talk about WHERE on the Peninsula you're buying or selling, because the numbers vary by city.
Here's the breakdown for 5,000+ square foot homes:
Palos Verdes Estates (164 sales):
Median close: $5.03 million
Median /sqft: \789
Median days on market: 93
Rancho Palos Verdes (133 sales):
Median close: $4.21 million
Median /sqft: \699
Median days on market: 86
Rolling Hills (71 sales):
Median close: $5.5 million
Median /sqft: \866
Median days on market: 132
Rolling Hills Estates (42 sales):
Median close: $4.3 million
Median /sqft: \830
Median days on market: 52
Notice Rolling Hills has the HIGHEST median price per square foot—but also the LONGEST time on market. That's the trophy property paradox: you can command a premium, but the buyer pool is thinner, so you need patience.
Rolling Hills Estates, on the other hand, has the FASTEST median time to sale. That suggests strong demand relative to supply in that segment.
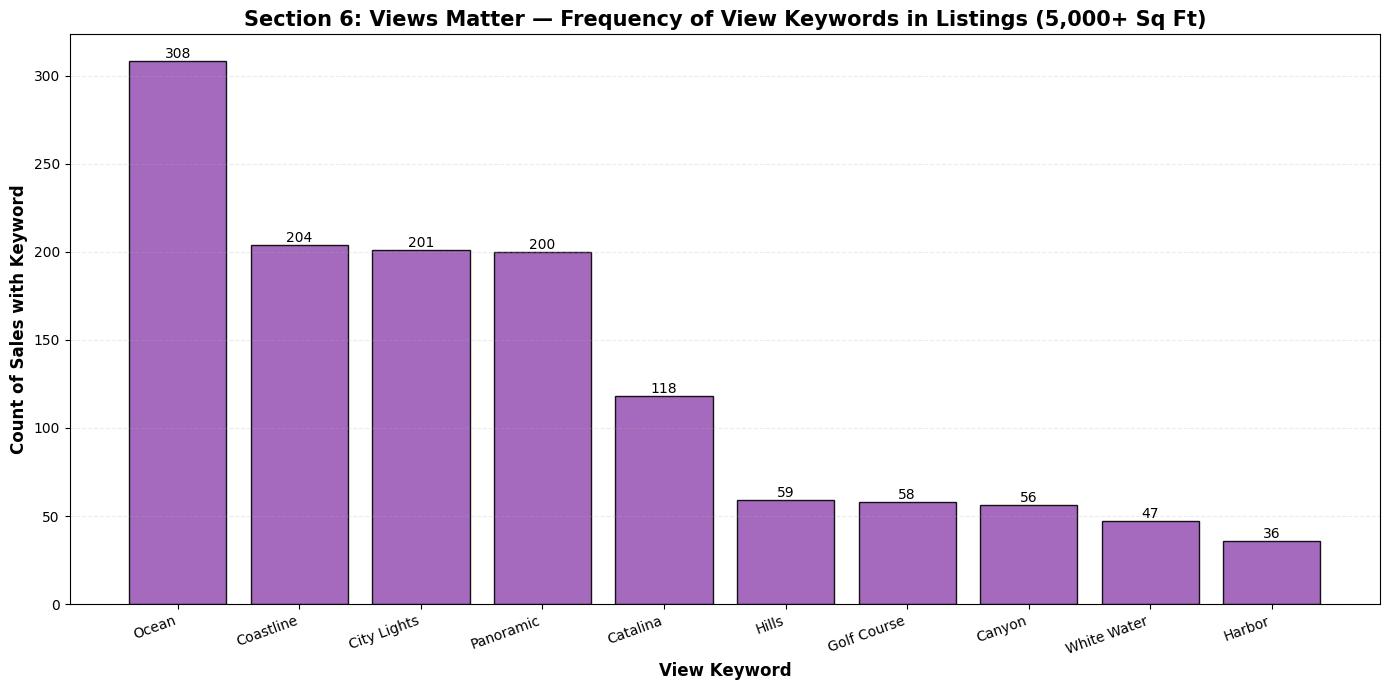
One of the most revealing parts of this dataset is the 'View' field. Here's how often specific view keywords appeared in the 416 sales:
Ocean: 308 sales (74%)
Coastline: 204
City Lights: 201
Panoramic: 200
Catalina: 118
Three out of four luxury sales in this segment have 'Ocean' in the view description. That's not a coincidence. In Palos Verdes, views aren't just a nice-to-have—they're a pricing driver.
And when you look at the top sales—the $15 million, $17 million, $22 million properties—they ALL have premium view language: Catalina, Coastline, Panoramic, White Water.
Bottom line: if you're selling without a view, you're competing on a different playing field. And if you're buying WITH a view, expect to pay for scarcity.
If you're thinking about selling a luxury home on the Peninsula, here's what this data tells you:
1. Pricing precision matters MORE now than it did in 2021-2023. The market is no longer forgiving overpricing. Median days on market is 119. That's four months. If you price aggressively, you'll sit.
2. Presentation and condition are everything. With more time on market and more buyer leverage, turnkey properties will outperform. Deferred maintenance or dated finishes will cost you in negotiation.
3. Expect to negotiate. The median sale-to-list ratio is 93.9% in the last 12 months. That means most sellers are coming down. Build that into your strategy.
4. Views still command premiums—but only if the rest of the package delivers. Ocean, Catalina, Panoramic—those words matter. But if the home itself doesn't match the view, buyers will walk.
Work with an agent who understands the DATA, not just the emotion. This is a numbers game now.
If you're shopping for a luxury estate in Palos Verdes or Rolling Hills, here's your advantage:
1. You have leverage. Homes are taking longer to sell. Sellers are negotiating. You're not in a bidding war environment anymore.
2. Inspection and repair credits are back on the table. In a hot market, buyers waive everything. In this market, you can ask for credits, repairs, and concessions—and you'll often get them.
3. Don't overpay for a view if the home doesn't deliver. Yes, ocean views command premiums. But if the layout is awkward, the finishes are dated, or the lot is compromised, don't let the view blind you to the fundamentals.
4. Be patient, but be ready. The best properties still move. If you find a turnkey estate with premium views in PVE or Rolling Hills, don't assume you have months to decide. The top 10% still sells fast.
This is a buyer's market compared to 2021-2023—but it's not a distressed market. Quality still wins.
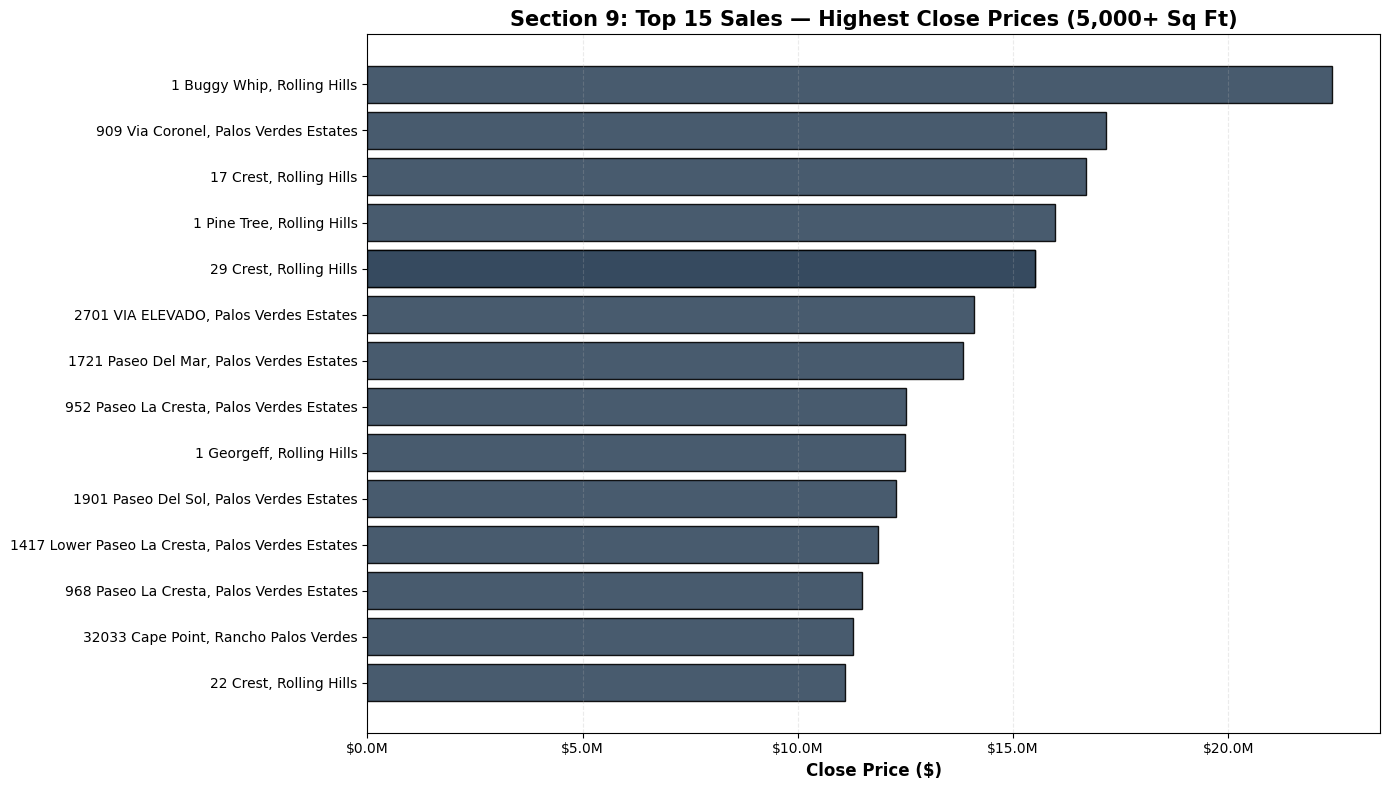
Let's talk about the TOP of the market, because these sales set the tone—and they're fascinating.
Here are the highest closed prices in the dataset for 5,000+ square foot homes:
1 Buggy Whip, Rolling Hills: $22.4 million (51,000 sq ft—extremely unique)
909 Via Coronel, Palos Verdes Estates: $17.15 million
17 Crest, Rolling Hills: $16.68 million
1 Pine Tree, Rolling Hills: $15.98 million
29 Crest, Rolling Hills: $15.5 million (sold twice in the dataset)
Notice a pattern? Rolling Hills dominates the ultra-high-end. These aren't just homes—they're compounds. Gated, private, often equestrian, with views that can't be replicated.
These sales don't represent the 'typical' luxury transaction. But they DO influence perception, headlines, and what buyers think is possible.
If you're selling in this tier, you're not competing on comps—you're competing on scarcity and story.
Alright, let's bring it all together. Here's what you need to remember:
1. The Palos Verdes luxury market has shifted from a seller's sprint to a buyer's negotiation. Median days on market tripled. Sale-to-list ratios dropped. Over-asking outcomes are rare.
2. The 12-month projection suggests further softening—about 13% decline in price per square foot. But that's based on recent trends. If rates drop, inventory tightens, or the stock market rallies, that could change.
3. Views, condition, and pricing precision are the three pillars of success in this market. If you have all three, you'll do well. If you're missing one, you'll struggle.
4. This is NOT a crash. It's a normalization. Prices are still high by historical standards. The market is still clearing. But the frenzy is over.
Whether you're buying, selling, or just watching the market—understanding the DATA gives you the edge.
If you found this analysis helpful, hit the like button, subscribe for more deep-dive real estate content, and drop a comment below: Are you buying, selling, or waiting?
And if you want a custom market analysis for YOUR property or YOUR search, reach out—link in the description.
Thanks for watching. I'll see you in the next one.