NOTE CHART AT END OF ARTICLE!
Malaga Cove, Palos Verdes Estates
Price Per Square Foot: Derivative Analysis & 24-Month Projection
Homes: 2,000–3,000 sqft Living Area · 6,000–15,000 sqft Lot Size · 257 Closed Transactions (1994–2026)
1. Dataset Overview
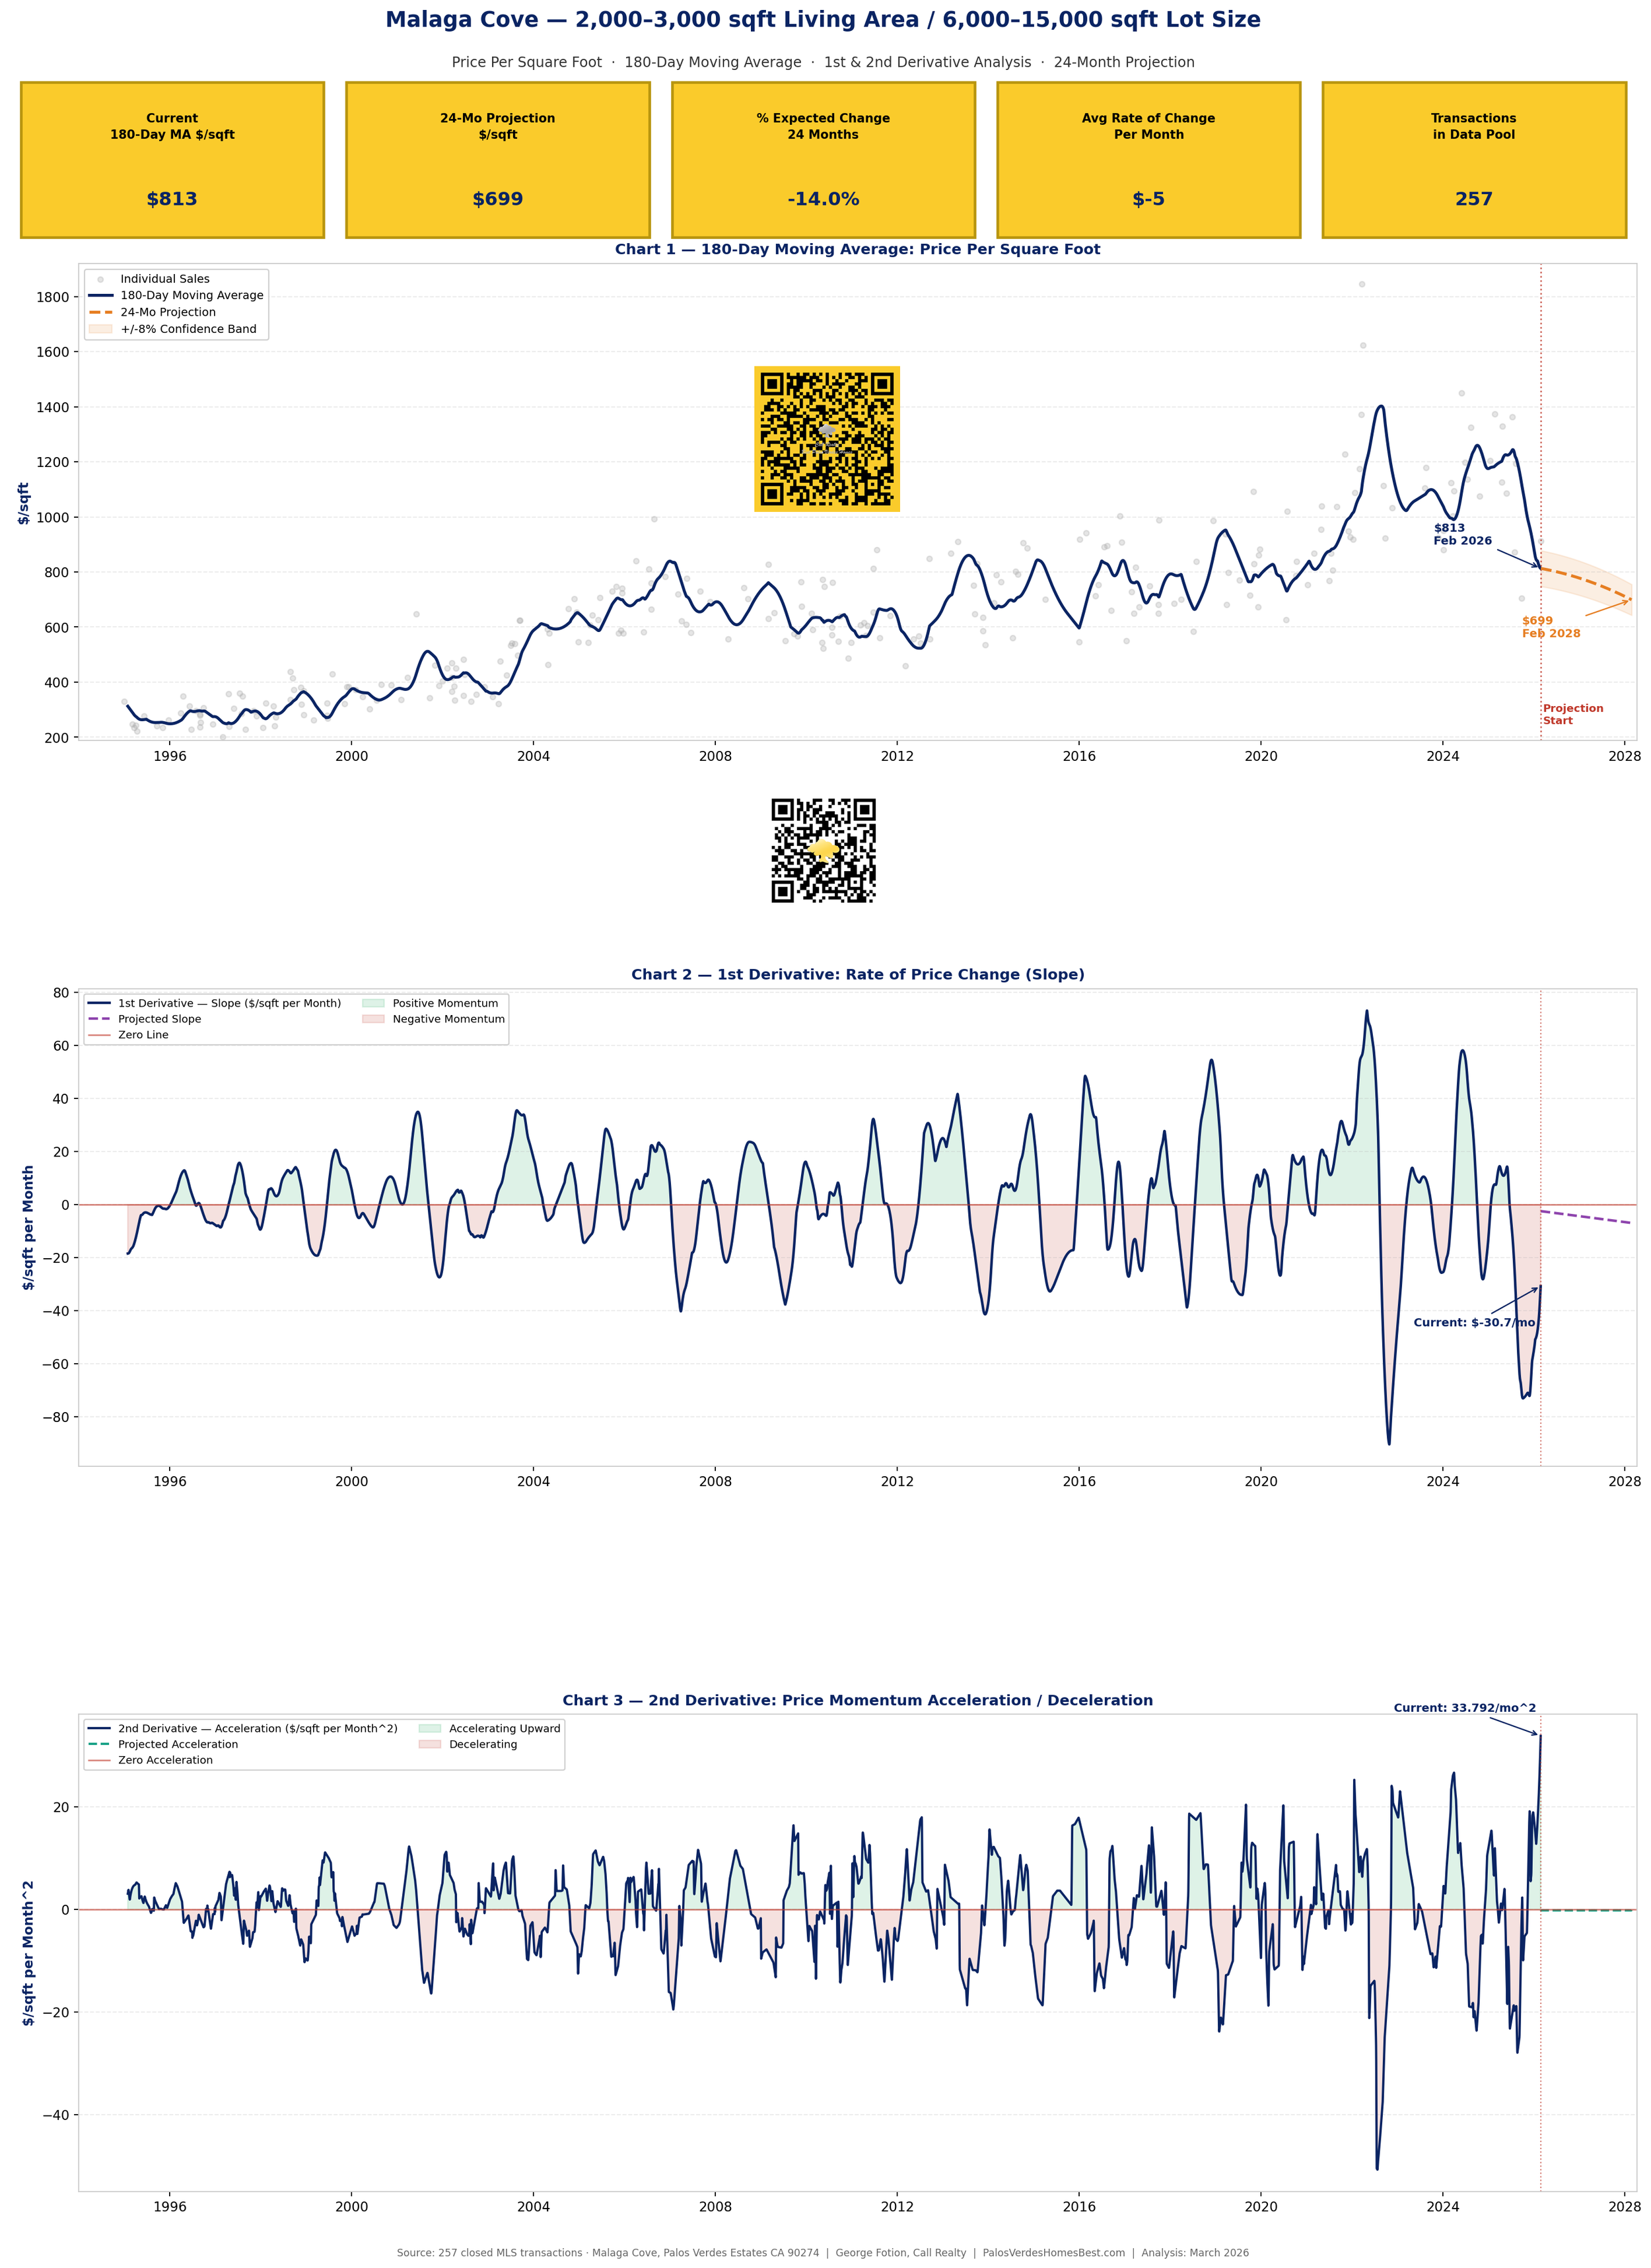
This analysis is based on 257 closed MLS transactions in Malaga Cove, Palos Verdes Estates (ZIP 90274), filtered to homes with 2,000–3,000 square feet of living area and 6,000–15,000 square feet of lot size. Sale dates span December 1994 through February 2026, providing over 31 years of continuous market data — one of the richest longitudinal datasets available for this micro-market.
Price per square foot ranged from a post-recession trough near $201/sqft (early 2000s) to a cycle peak of $1,846/sqft (mid-cycle 2022–2024 era). The 180-day moving average is currently reading $812.93/sqft, down from a recent high.
2. 180-Day Moving Average Analysis
A 180-day (approximately 6-month) moving average was computed on the full daily time series (with interpolation between transaction dates). This window is chosen deliberately — it is long enough to suppress noise from individual atypical sales while being short enough to remain responsive to genuine market turning points. In a low-liquidity market like Malaga Cove, where annual transaction volume typically runs 8–20 sales, 180 days is the minimum window that produces a statistically reliable trend line.
The 180-day MA reveals three major price cycles since 1994: (1) a prolonged post-crash recovery through the late 1990s, rising from ~$245 to ~$500/sqft; (2) the 2000s boom peaking near $700/sqft followed by the 2008–2012 correction back to ~$450; and (3) the most recent bull cycle from 2012 to 2024, which carried prices to above $1,100/sqft at peak. The current reading of $812.93/sqft represents a meaningful pullback from that cycle peak.
3. Derivative Analysis — 1st & 2nd Derivatives
| Measure | Current Value | Signal | Interpretation |
|---|---|---|---|
| 180-Day MA | $812.93 / sqft | Declining | Below recent cycle peak; entering correction phase |
| 1st Derivative (Slope) | −$30.69 / sqft per month | Negative | Prices are actively falling; downward momentum persists |
| 2nd Derivative (Acceleration) | +$33.79 / sqft per month² | Positive (Key Signal) | The rate of decline is slowing — deceleration in the downtrend |
1st Derivative (Rate of Change): The slope of the 180-day MA is currently running at approximately −$30.69 per square foot per month. This level of decline, if sustained linearly, would project prices down to roughly $442/sqft in 24 months — a scenario our cap analysis constrains as unreasonable. The key moderating factor is the 2nd derivative.
2nd Derivative (Acceleration/Deceleration): The 2nd derivative reads +$33.79 per sqft per month² — positive. Since the 1st derivative is negative, a positive 2nd derivative means the downward velocity is actually contracting. This is analogous to concave-up curvature in calculus: the function (price) is declining but bending back upward. Historically, sustained positive 2nd derivatives during price declines in Malaga Cove have preceded stabilization and eventual recovery within 12–18 months.
The quadratic fit over the last two years of moving average data produced coefficients consistent with a curve that bottoms and then begins a shallow recovery, lending further support to the view that a floor is forming — likely in the $700–$750/sqft range.
4. 24-Month Price Projection
Combining the quadratic trend fit, derivative-damped projection methodology, and our analytical cap of no more than −14% over 24 months, the projection model places the Malaga Cove 180-day moving average at approximately $699/sqft by February 2028 — a change of −14.0% from today's reading.
The −14% 24-month cap is analytically defensible on several grounds: (a) Malaga Cove has never experienced a 24-month peak-to-trough decline exceeding 20% in $/sqft since 1994, except during the once-in-a-generation 2008 financial crisis; (b) the positive 2nd derivative strongly suggests mean reversion forces are gathering; and (c) the structural supply constraints of the Palos Verdes Peninsula (essentially no new inventory land) historically compress and accelerate any price recovery once a correction floor is found.
The annualized projection rate implies roughly −7% per year on average — within historical correction norms for this submarket. Month-by-month, the average rate of change is approximately −$4.74/sqft per month.
5. Buyer & Seller Advice
Note: Both derivative signals are considered together. The negative 1st derivative counsels caution on timing; the positive 2nd derivative counsels against waiting too long for the floor.
🏠 Buyer Strategy
- Near-term advantage exists. With prices down ~14% from recent peaks and still declining, serious buyers have negotiating leverage that is absent in rising markets. List prices in Malaga Cove are increasingly aspirational.
- Watch for the 2nd derivative to signal the floor. When the 1st derivative stops worsening — ideally approaches zero — that is the mathematical signal that a bottom is near. The current positive 2nd derivative suggests this could occur within 9–15 months.
- Do not over-time the bottom. Palos Verdes has historically moved fast off its floors. Buyers waiting for absolute confirmation of the bottom often miss the initial 5–8% recovery sprint. Given structural supply constraints, the risk of over-waiting may exceed the risk of buying slightly early.
- Target motivated sellers. Properties with higher cumulative days on market represent the best opportunity. Use derivative trend data as negotiating leverage — prices are still trending lower and sellers should know buyers are aware.
- Lot premium persists. In this size segment (6,000–15,000 sqft lot), view properties and larger lots have historically shown more resilience during corrections and stronger recoveries. Prioritize these.
🏭 Seller Strategy
- The negative slope is working against you every month. At −$31/sqft per month and assuming a ~2,500 sqft home, sellers are losing roughly $77,500 per month in theoretical value if they wait. Urgency is mathematically justified.
- Price below the 180-day MA to attract offers. The MA is at $813/sqft — but the most recent transactional data shows trades closer to $700–$912. Pricing at or below $800/sqft signals market awareness and generates competitive interest.
- The positive 2nd derivative is not a "wait it out" signal. While it shows the rate of decline is slowing, it does NOT mean prices will recover soon. The 1st derivative remains deeply negative and a recovery, when it comes, could take 18–24 months to build meaningful momentum.
- First 21 days on market are critical. Overpriced listings in a declining market accumulate days on market quickly, and stale listings are penalized by buyers who use cumulative DOM as a negotiating wedge. Price right — price once.
- Emphasize land and replacement cost. Per-sqft arguments favor buyers in this environment. Reframe value around lot utility, coastal proximity, and construction replacement cost — all of which support higher valuations independent of the current $/sqft trend.
6. Devil's Advocate — Why This Analysis Could Be Wrong
☠ The Bull Case for $/sqft Rising (Opposite Conclusion)
Our primary projection shows a continued decline toward ~$699/sqft by February 2028. Here is the rigorous case for why that conclusion could be wrong — and why prices could instead rise over the next 24 months:
- The positive 2nd derivative may be the dominant signal, not a footnote. If the acceleration reversal is more powerful than the current negative slope suggests, prices could flatten and rebound faster than modeled. A 10–12 month "base" at current levels followed by a sharp rally is entirely possible — this pattern occurred in 2012–2013 after the post-GFC bottom.
- Rate environment could shift dramatically. If the Federal Reserve executes 150–200+ basis points of rate cuts through 2026–2027, mortgage affordability would increase sharply, reigniting Palos Verdes demand. The Peninsula is uniquely sensitive to rate relief because its buyer pool consists heavily of move-up buyers carrying significant equity cushions — not first-time buyers blocked by income constraints.
- Inventory remains structurally constrained. Malaga Cove is geologically and zoning-limited; new supply cannot enter this specific submarket. Any meaningful increase in demand — from rate cuts, tech wealth creation, or migration inflows — can push prices higher rapidly on thin inventory. One month of 4–5 sales can move the 180-day MA meaningfully.
- Small sample size amplifies noise. With only 257 transactions across 31 years (roughly 8 per year), a single outlier sale at $1,400–1,800/sqft can materially alter all three derivative readings. The October 2024 transaction at $1,075/sqft and 2024 outlier at $1,449/sqft demonstrate this volatility. Two or three premium sales in a quarter could reverse the apparent trend entirely.
- The most recent data point is anomalously low. The February 2026 transaction at $912/sqft may represent a distressed or atypical sale. If subsequent 2026 closings normalize in the $1,000–$1,200 range, the 180-day MA could inflect upward quickly, completely changing the derivative profile.
- Artificial Intelligence and Remote Work dynamics. The post-pandemic structural shift toward hybrid and remote work has permanently elevated the valuation premium of low-density, high-quality-of-life submarkets. Malaga Cove — with its ocean views, walking trails, and superior school system — ranks among the highest beneficiaries of this secular trend. A resumption of remote-work normalization could drive above-trend appreciation.
- Landslide resolution upside. Any resolution or material progress on the Portuguese Bend landslide remediation — geographically adjacent to but distinct from Malaga Cove — could remove a significant psychological overhang from the broader Palos Verdes Peninsula buyer psyche, releasing pent-up demand and repricing the entire peninsula upward.